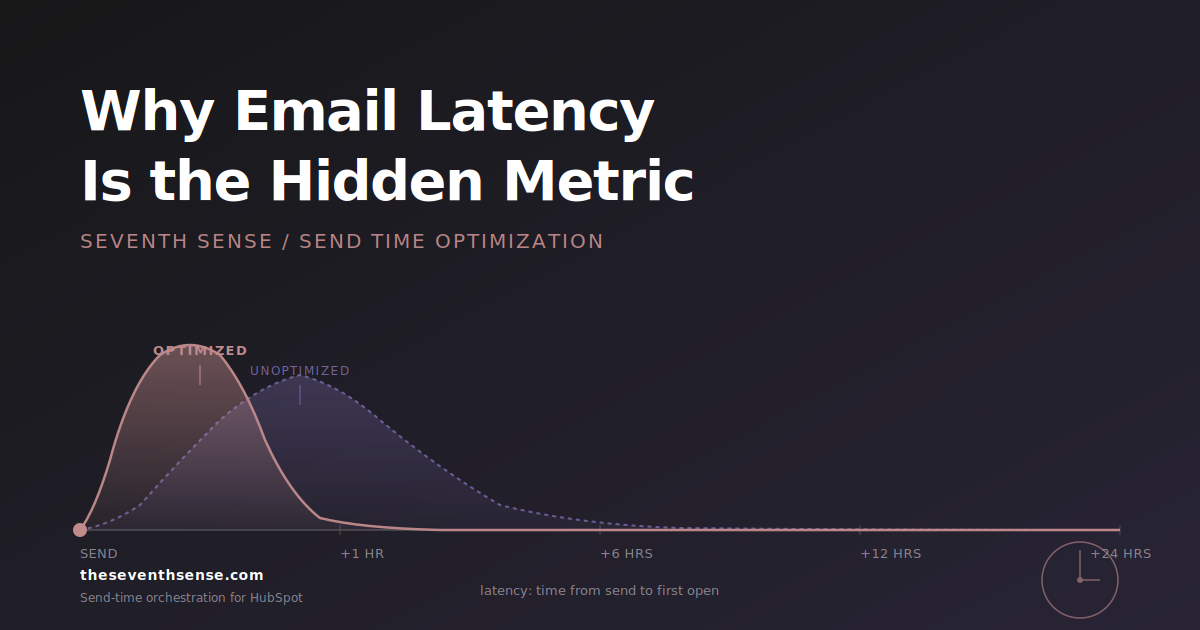
What would happen if we sent our monthly email newsletter at the worst engagement time vs. using send time optimization over 24-hours?
We wanted an answer to this question so we ran an experiment with our newsletter last month. While the results weren’t shocking, at least to us, there were a number of learnings (and data to support our hypotheses). In God we trust, all others must bring data!
Finding the worst time to send our email newsletter
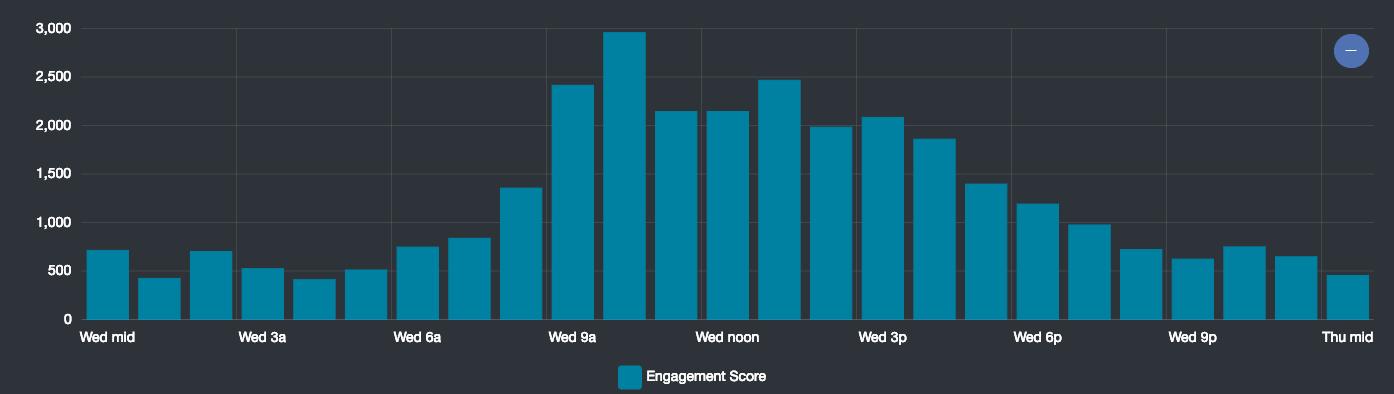
In order to understand what the worst aggregate engagement time for our audience was, we turned to an engagement graph in Seventh Sense. This ended up being at 4:00 AM EST on Wednesday. Mind you, this is not the worst time for everyone. For some people, this is their most optimal engagement time, but it’s the lowest point of engagement across the week. Think about all those studies you’ve read on the best time to send emails that come with a graph similar to the below. This is that graph of our all time email engagement on a Wednesday.
So without further ado, below are the results.
What did the time spent viewing the newsletter tell us?
Like many marketing automation systems, HubSpot, the marketing automation platform we use, tracks how long someone views your email when they open it.
To understand how this works, it’s good to familiarize yourself with how email open tracking works. It’s very similar, but the difference is, instead of just sending the image and being done with it, they start sending the pixel and never finish, leaving the connection open. Then they watch for the connection to be terminated and count the seconds between the time the connection was opened and the time it was terminated. Voilà!
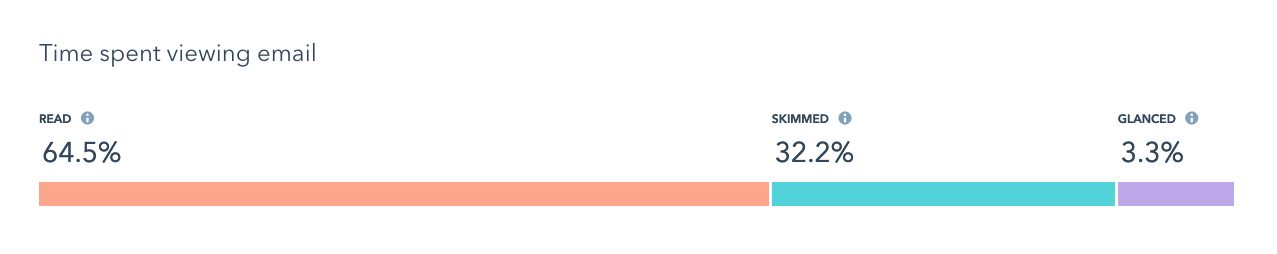
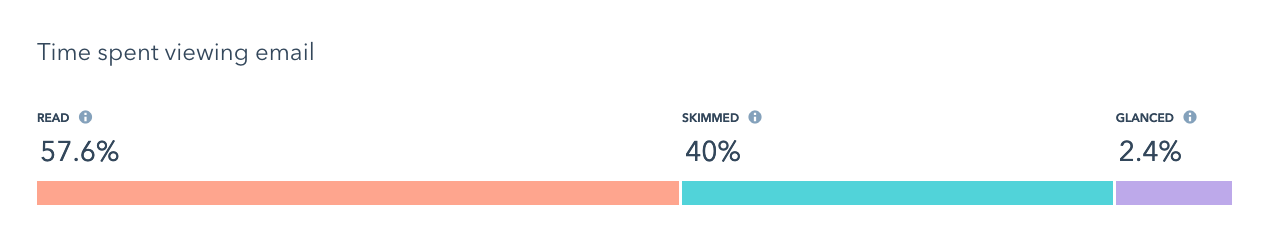
People that opened the newsletter that were sent at personalized times, on average, “read” the email 12% longer than people who opened the newsletter that was sent at the worst aggregate engagement time. In short, we were connecting with people when they had more time to actively engage in the newsletter.
Personalized Send Times:
Worst Aggregate Send Time:
What did the open data tell us?
Could sending at the worst aggregate engagement time affect open rates? For us, that’s not really a fair question because we have an enormous amount of data and test results that prove sending at personalized times perform better than sending email at the most optimal engagement time for an entire audience.
Below is a screenshot highlighting the difference in open rates between the two cohorts which represented a 16.07% open rate increase in favor of emails sent at personalized delivery times.
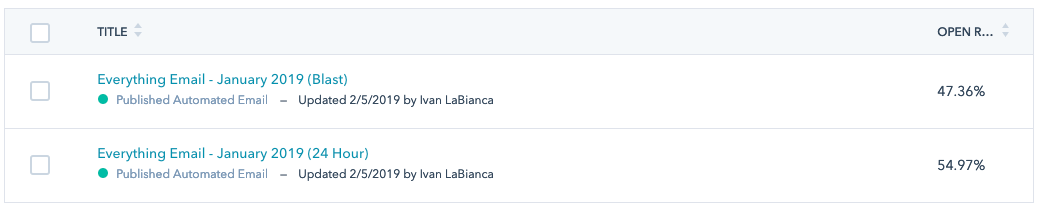
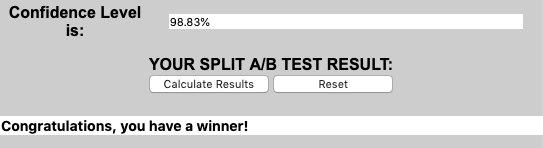
I was curious how these results would stand up with a data nerd, so used a nifty calculator to understand the statistical significance (screenshot below).
Additionally, on average, the people that were sent the newsletter at personalized times opened the email 2.18 times vs. 1.83 times for people that were sent at the worst aggregate engagement time. This represented a 19% increase in the total times the newsletter was opened by people that received it at a personalized time vs. the people that were sent the newsletter at the worst aggregate engagement time and opened it.
Some might be thinking, woah, that makes no sense. Why would people who were sent the newsletter at a personalized time open the same email more than people who received their newsletter at the worse aggregate engagement time? Shouldn’t it be the other way around? Conventional wisdom might say so, but if you dig deeper into the data, this means that you caught their attention and they were willing to; one, forward your email (this can also create more opens from the original recipient by the forwarded recipients that open the email) and two, you caught enough of their attention that they continue to refer back to the email.
To us this was an awesome signal as it meant not only more inbox impressions, but also engagement.
What did the click data tell us?
This was one of the most interesting areas to explore, so I examined this far deeper than opens. Unfortunately, there wasn’t enough signal to provide a statistically significant answer, however, there were still learnings to be had (if you want to read a fascinating article on why many scientists are now calling for an end to statistical significance, I highly recommend this article in Nature).
For people that were sent the newsletter at a personalized time and clicked, on average, clicked 1.639 links whereas the people that were sent the newsletter at the aggregate worst time and clicked, only clicked 1.275 links. This represents a 22.21% increase in the number of unique links clicked in favor of receiving the newsletter at a personalized time. Our newsletter has multiple links to articles, webinars, job openings and a marketing tool of the month that we highlight. Another great signal that people were more engaged by receiving the newsletter at a personalized time.
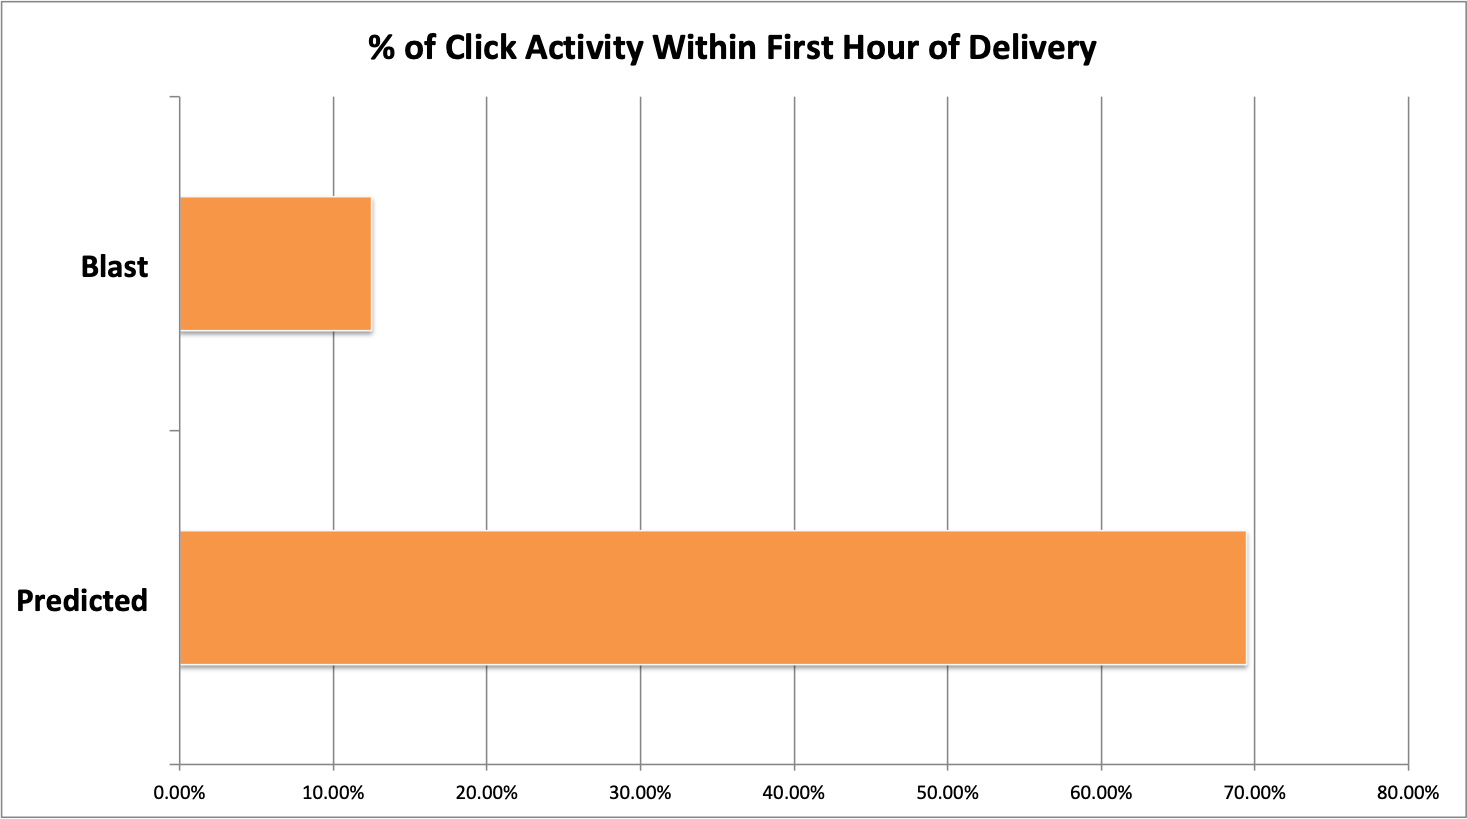
Another interesting area that we focussed on was how soon after someone received the newsletter did they click on at least one link. Newsletters that were sent at personalized times were clicked on 456% higher in the first hour of delivery than newsletters that were sent at the aggregate worst time. Another great sign as we weren’t leaving things to chance and having the newsletter buried under a mirage of other email or for the inbox zero people, they didn’t immediately hit the delete button on their mobile phone.
The below chart highlights the percentage of the first click activity that occurred within one hour after the newsletter was sent.
What did the unsubscribe data tell us?
Could sending the newsletter at the worst aggregate engagement time affect unsubscribes? I had a suspicion that it would, but didn’t have the data to prove it until now.
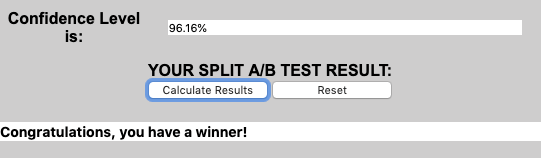
Looking at the data, unsubscribes were 214% higher with the newsletter that was sent at the worst aggregate time vs. sending at personalized times. While the physical number of unsubscribes was low, I once again wanted to see how they stood up statistically.
Have you ever called a colleague, boss, friend, family member or even your significant other only to have them answer with an unfriendly tone or expletive and hang up? The same holds true with other forms of communication and in this case, our newsletter. Unfortunately, we didn’t use the data we had on hand and paid a price. We got an expletive and a hang up in the form of an “unsubscribe” even though we were only trying to run an experiment!
Conclusion
For all the pundits that claim you should try to send your email early so you can be at the top of the inbox when people are first checking their email, you might want to rethink your advice. While that may be optimal for some, it clearly isn't for most.
Are you a HubSpot or Marketo user interested in learning more about how Seventh Sense can help you get a higher ROI from email? Book your free consultation today.
See what your email program could be doing.
Connect Seventh Sense to your HubSpot portal and watch the AI surface per-person engagement profiles, per-inbox-provider performance, and AI-driven optimization recommendations - within 24 hours.
Try it free →