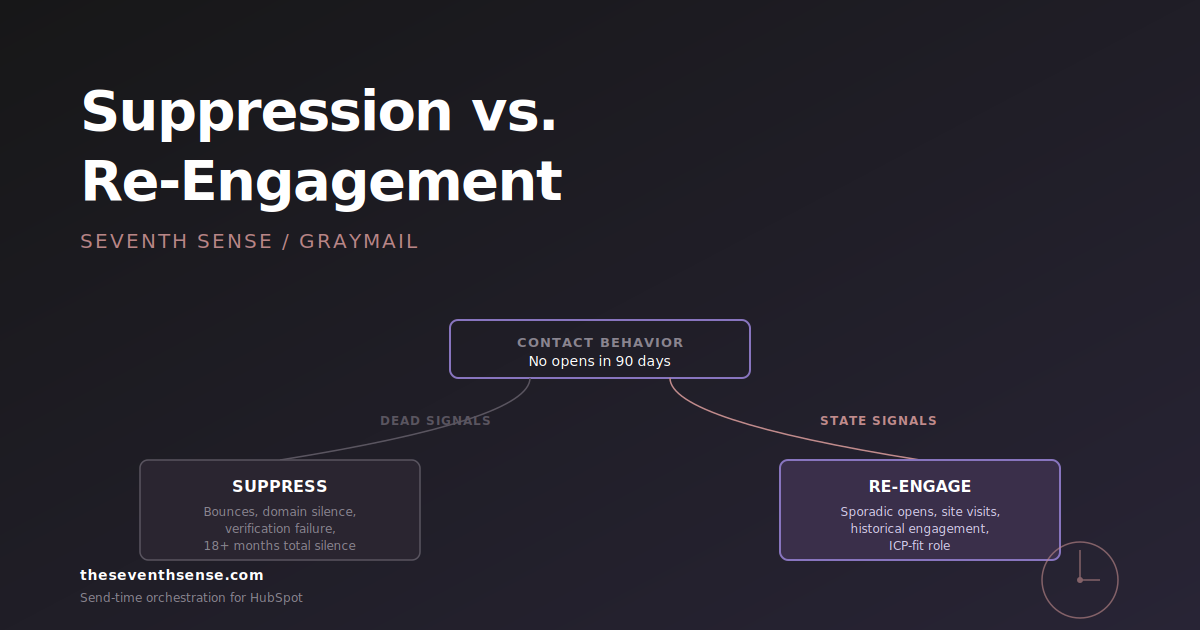
A VP of marketing called me last fall, two weeks into a new send-time-optimization rollout, frustrated. "Our open rates went up four points," he said, "but I have no idea if that's because of STO or because the content was just better this quarter. There's no way to prove it." He was right, and the thing he needed to prove it was sitting in front of him — he just couldn't see it, because his platform didn't surface it.
The metric he needed was email engagement latency: the gap between the moment a send hits the inbox and the moment the recipient first opens it. It's the cleanest possible proof that send-time optimization is working, and almost no major email platform reports it. There are reasons for that, and they aren't flattering.
What email engagement latency actually measures
Engagement latency is a deceptively simple number. For any individual send, it's the time between when the email arrived in the recipient's inbox and when she opened it. For a campaign, it's the distribution of those times across every recipient. For a sender, it's the average across all campaigns.
Most platforms report aggregate metrics that don't capture this: open rate (yes/no), click-through rate (yes/no), unsubscribe rate (yes/no). Those metrics tell you whether the recipient engaged. Engagement latency tells you how close you were to her real reading window.
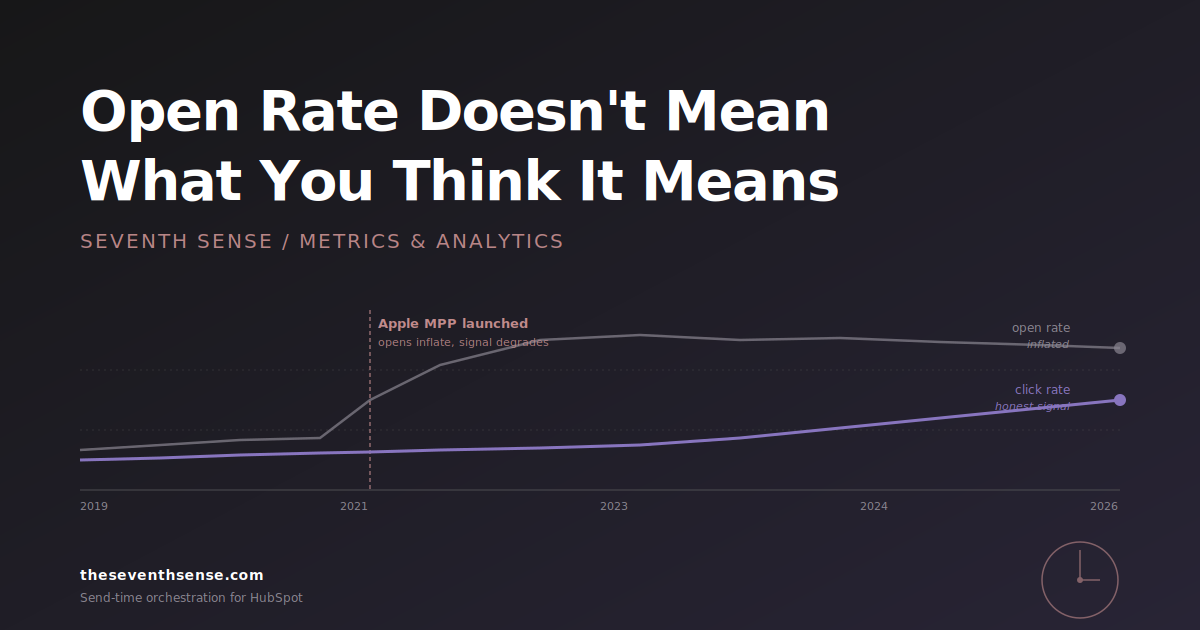
A 25% open rate could come from sending at the right time (and 25% of your list is genuinely interested) or from sending at the wrong time (and 25% happened to check their inbox before the email aged out of attention). The open rate looks identical. The engagement latency tells you which one happened. This is part of why open rate accuracy collapsed after Apple Mail Privacy Protection shipped — the metric measures something the platforms don't want to admit.
Why this is the truest proof that STO is working
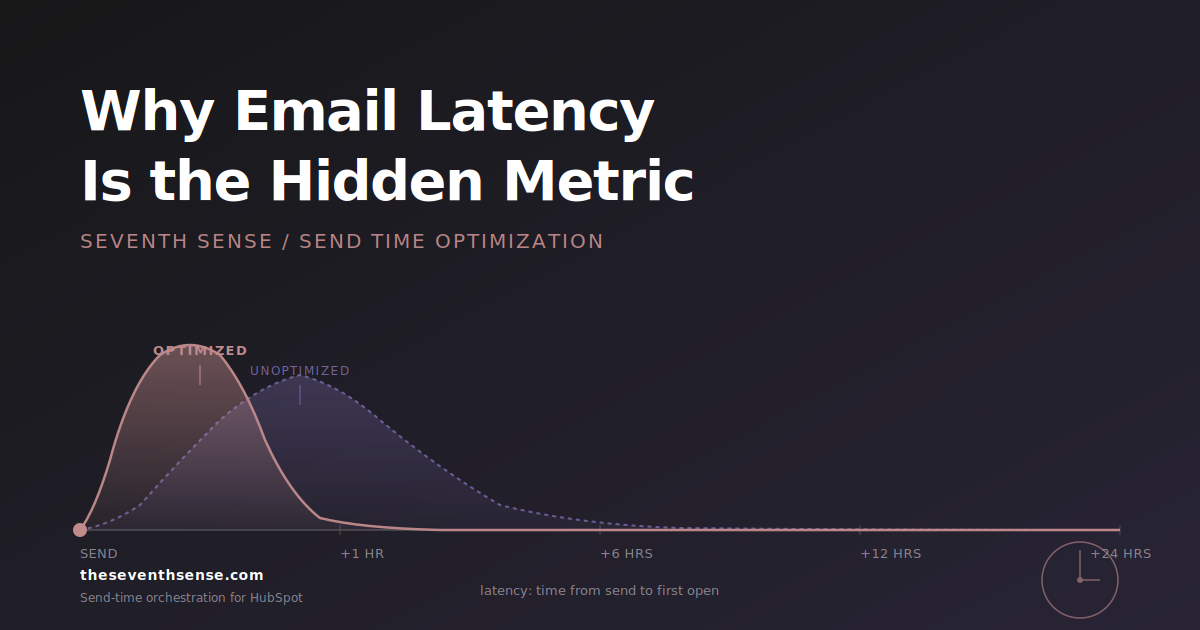
Send time optimization makes a specific claim: by scheduling the send closer to each recipient's natural reading window, the recipient engages faster, more reliably, and earlier in the message's life. Every part of that claim is a statement about latency.
If STO is working, you should see:
- Lower median latency — opens happen closer to send.
- Tighter distribution — latency variance shrinks because recipients are getting hit closer to their window rather than at random points.
- More mass in the first hour — the engagement that does happen, happens faster.
You can't fake those numbers with better subject lines. You can't fake them with cleaner lists. You can't fake them with prettier templates. Those are all real levers, and they all move open rate. None of them move latency. Latency moves only when you actually hit the recipient's window better than you did before. That's what makes it the cleanest STO proof there is.
Why no major platform reports email engagement latency
The honest answer is that latency makes most platforms look bad. If your platform schedules every recipient at the same hour, your latency distribution is shaped by the recipients' habits, not by your scheduling — and it tends to be wide and ugly. The median is hours, not minutes. The long tail stretches to days. Surfacing that number invites the question "why is this so wide?" and the answer is "because we sent everyone at once and hoped for the best."
A few less-honest reasons compound it:
- The metric isn't standard. Open rate has a textbook definition. Latency has half a dozen reasonable definitions (mean? median? first-hour share?), and platforms haven't converged on one. Reporting an unstandardized metric makes comparison hard, and comparison is what users want.
- It's expensive to compute well. Per-recipient latency requires holding open timestamps alongside send timestamps, joining across millions of rows per campaign. Cheap to compute approximately, expensive to compute correctly.
- It exposes the wrong thing for some platforms to expose. If your platform's STO is the campaign-level kind, exposing latency would let users see how little STO moved the number. Better to not show it.
None of those reasons are good ones. They're explanations for the absence, not justifications for it.
What email engagement latency tells you that open rate can't
The thing latency captures that open rate misses is quality of attention. Two campaigns can have identical open rates and wildly different reader behavior:
- Campaign A: 22% open rate, median latency 18 minutes, first-hour opens are 71% of total.
- Campaign B: 22% open rate, median latency 6 hours, first-hour opens are 19% of total.
Same headline number, completely different stories. Campaign A reached people at their window — the engagement was concentrated, immediate, intentional. Campaign B got the same headline by accident — the engagement was scattered across the day as people opened the email whenever they happened to check their inbox. Same open rate, different reader. The follow-up campaign performance will diverge dramatically.
This is why the principle that matters here is: the open rate tells you the destination. The latency tells you the path you took to get there. Two paths can land at the same place; one of them is repeatable, the other was luck.
How Seventh Sense reports latency
In October 2025, we shipped Email Latency Metrics as a first-class part of our reporting. For every campaign, you see the latency distribution alongside the standard metrics — not buried in a sub-report, not as an export, but on the same dashboard where you read open and click rates. The first-hour engagement share is broken out as a separate number because it's the part that matters most to deliverability.
The reason we built this is that our customers were asking the same question the VP of marketing was asking: how do I prove STO is working? We could see in our data that it was, but until we surfaced the latency distribution, customers had no way to verify it themselves. The product change was less about adding new tracking and more about exposing what was already there.
The side effect we didn't fully anticipate was that customers started using latency to diagnose problems unrelated to STO. A latency distribution that suddenly widens is an early warning sign of a deliverability issue — the email is being inbox-throttled, landing in promotions, or being held back by content filtering. Open rate doesn't catch this until weeks later when enough campaigns have degraded to move the average. Latency catches it on the first campaign. Litmus's research on engagement timing covers some of the same dynamics on the analytics side.
How to read a latency distribution
Once you have the metric, the question becomes how to use it. Three patterns I'd watch for:
The healthy distribution
Median latency under 30 minutes, first-hour share above 50%, tail (opens after 24 hours) under 10%. This is what good STO looks like. Engagement is concentrated, immediate, and predictable.
The lazy-list distribution
Median latency several hours, first-hour share under 20%, long tail extending to days. This is usually a list problem (low engagement, weak intent) rather than an STO problem. STO will help, but the underlying issue is the list isn't very engaged to begin with.
The window-miss distribution
Bimodal — a small spike of immediate opens followed by a long, scattered tail. This is what you see when your campaign hits the right window for part of the list and the wrong window for the rest. It's the classic signature of campaign-level scheduling on a time-diverse list, and it's the easiest thing for recipient-level STO to fix.
Frequently asked questions about email engagement latency
How is email engagement latency calculated?
The standard calculation is the time between the email's delivery timestamp (when the receiving mail server accepted it) and the first open event recorded for that recipient. Some platforms use send timestamp instead of delivery timestamp, which can add a few minutes of noise for senders with long queues but doesn't materially change the distribution.
Is shorter latency always better?
Generally yes, but there's a floor. Latency below 2 minutes often indicates bot opens (security scanners, prefetch systems) rather than human engagement. The healthiest distributions have a small initial bump from bots followed by the real human peak in the 5–60 minute range.
Does email latency affect deliverability?
Indirectly, but powerfully. Mailbox providers track engagement signals including how quickly recipients open mail from a sender. Google's sender guidelines specifically call out user engagement as a reputation input. Fast, consistent engagement reinforces sender reputation. Slow, scattered engagement signals the email wasn't valuable enough to read promptly, which degrades reputation over time. The compounding effect is what makes the first-hour engagement window so load-bearing for long-term sender health.
Why isn't email engagement latency in HubSpot's native reports?
HubSpot reports aggregate open and click data but doesn't expose per-recipient latency distributions in standard reports. The data exists in the platform — events are timestamped — but the visualization layer doesn't surface it. Third-party tools like Seventh Sense compute and display the distribution directly.
Where to go from here
If you're trying to evaluate whether your send-time optimization is actually working, ignore the open rate. The open rate is the metric your platform wants you to look at because it's the metric that flatters the platform. Look at the latency distribution instead.
The free trial of Seventh Sense includes the full latency reporting and runs against your existing HubSpot data. You can connect it, send one campaign with the AI scheduler, and compare the distribution to your previous campaigns — the proof or the disproof of STO is right there in the shape of the curve.
Open rate is the score. Latency is the game film. You'll learn more from one campaign of game film than from a quarter of looking at the score.
See what your email program could be doing.
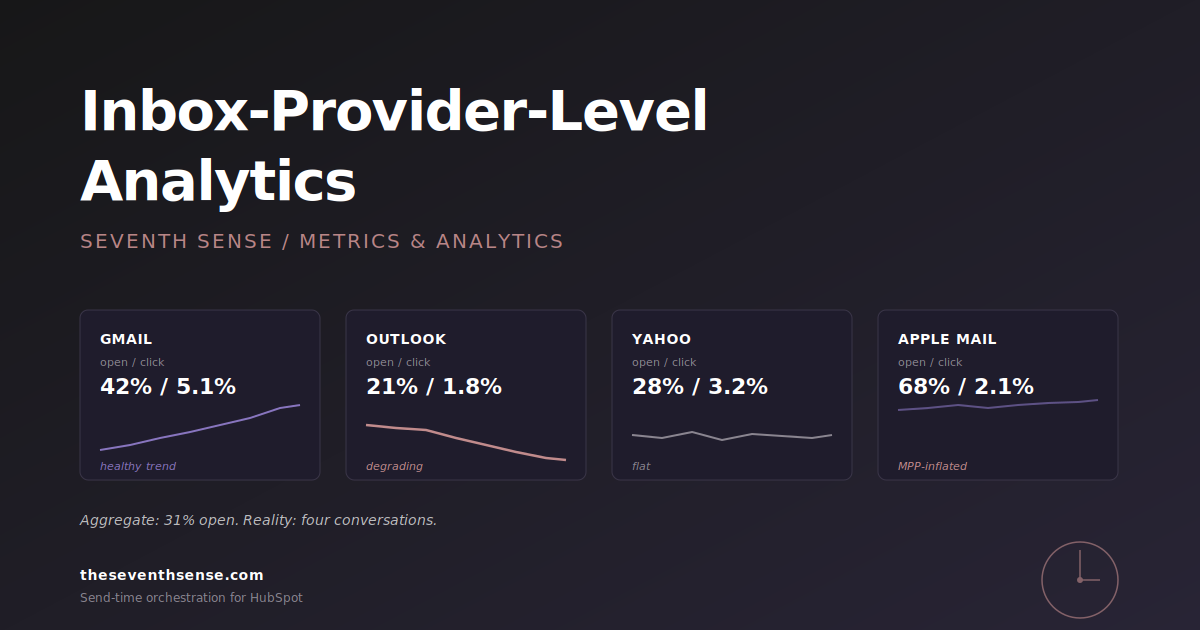
Connect Seventh Sense to your HubSpot portal and watch the AI surface per-person engagement profiles, per-inbox-provider performance, and AI-driven optimization recommendations - within 24 hours.
Try it free →